
Target Audience: Anyone wanting to see Claude Code in action
Claude Code Key Points:
• Can analyse data anomalies
• Writes code on its own to investigate
• Self-adjusts direction based on findings
GitHub: plot-py-repo to count/classify lines of code and visualise repository growth over time.
This article tells a story in pictures of working within Claude Code. The simplicity masks the power you have at hand.
I start off with a chart that showed data in a shape I did not expect. I put Claude Code into planning mode to find the root cause. In the end it, it was found and fixed.
Just imagine how many other things Claude Code could investigate, hypothesise, and test.
In this analysis, I use my plot-py-repo tool to analyse my youtube-to-xml repository.
The Problem
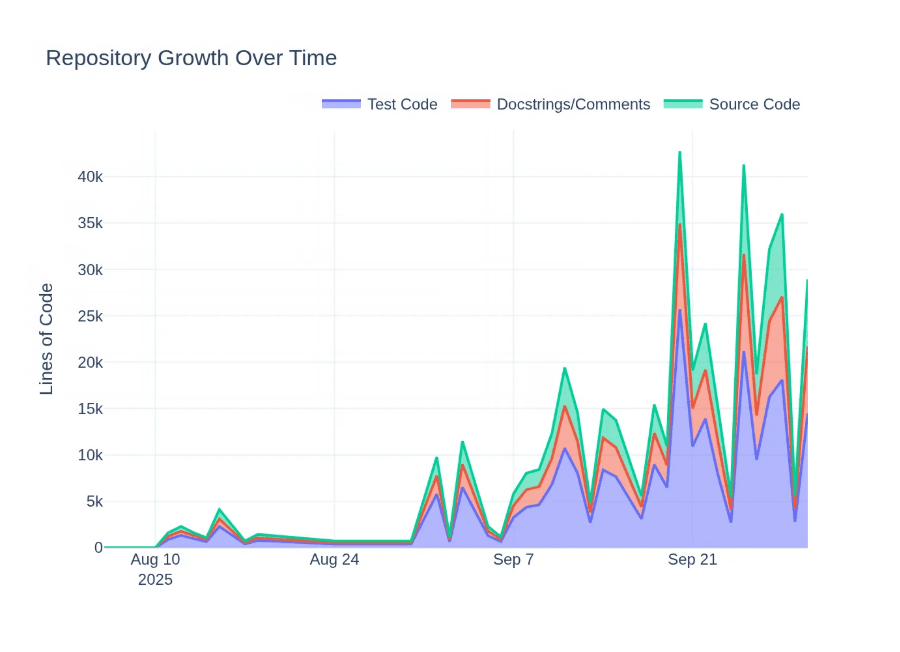
All the code that I do is 100% written by Claude Code. I wanted to see my repositories over time and what they are comprised of. So, I created a tool to count and classify lines1 and visualised my youtube-to-xml repository2.
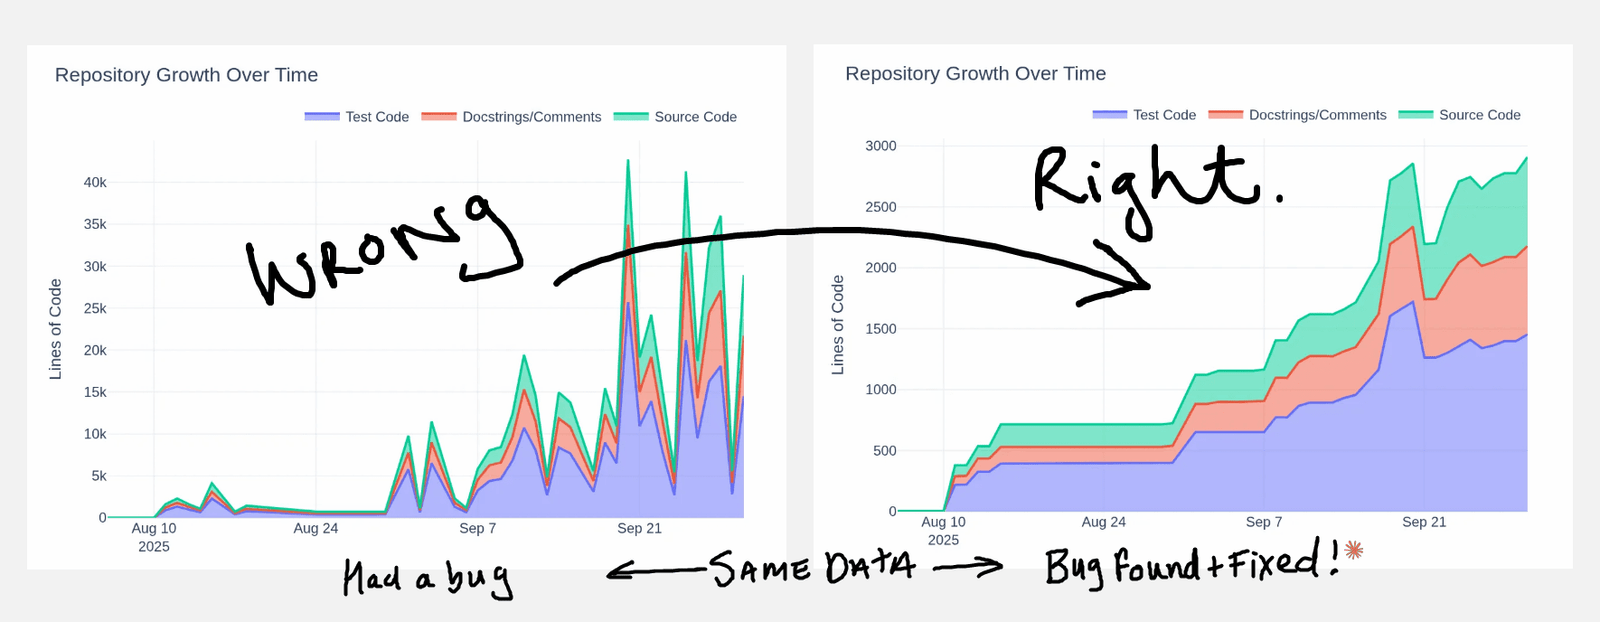
I write a lot of tests, so when I saw a lot of purple, I was pleased. But three peaks in September? No, I don’t remember being extraordinarily efficient. But where to start, the source, the transformations, the code?
Claude Code Sherlock Holmes — Finding the Root Cause
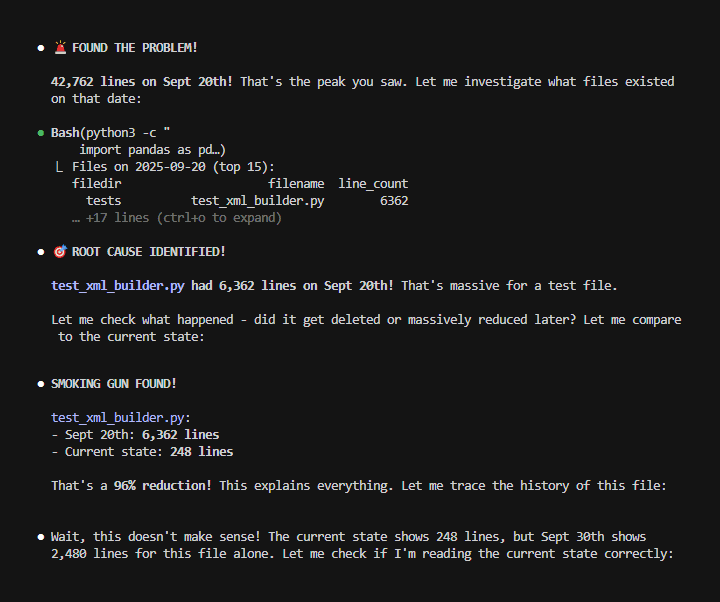
All of these screenshots are taken from within my codebase that creates these images. Think of each as a page in a storybook of what it’s like to work with Claude Code. And here is the first page where I am instructing Claude Code to make a plan:
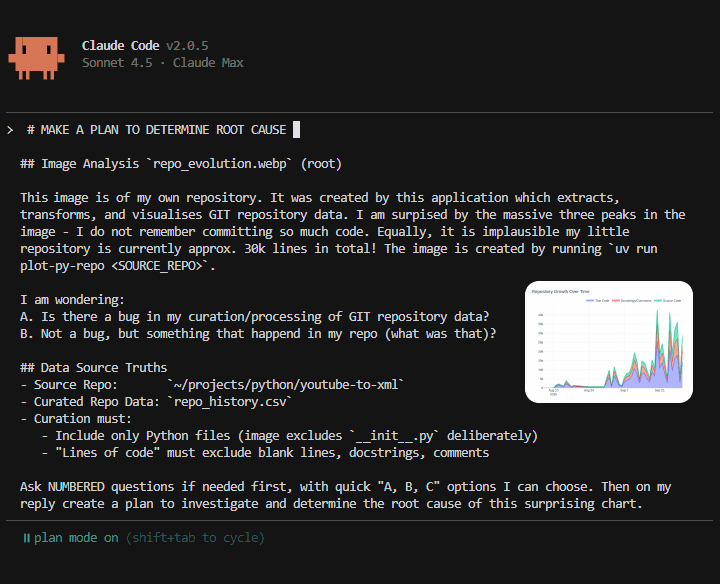
On the last line of the image 1, I ask Claude Code to ask me questions first. This is for two reasons: first, what is crystal clear in my head is seldom clear in my writing. Second, there are aspects I miss but Claude Code doesn’t. Q&A is a good cheat:
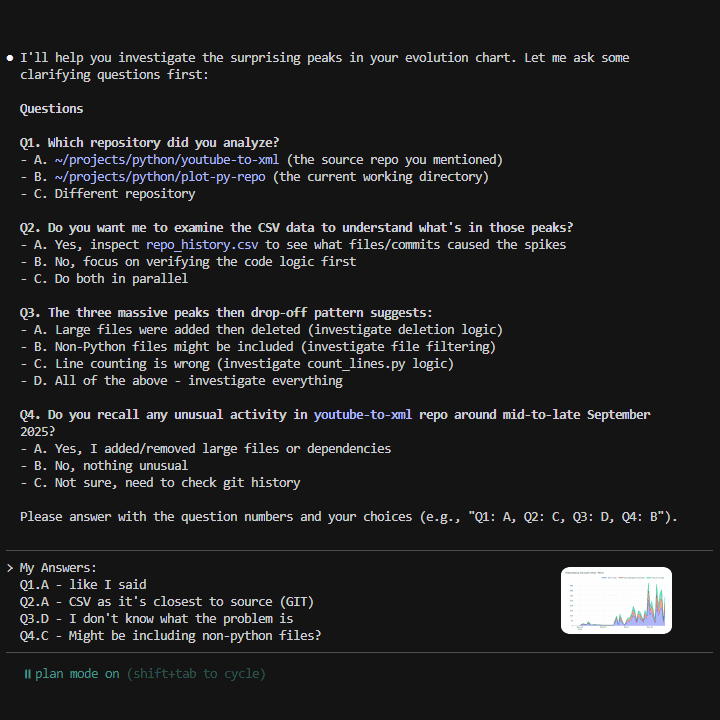
With my answers, Claude Code takes a preliminary look around in the files and then crafted the investigation plan:
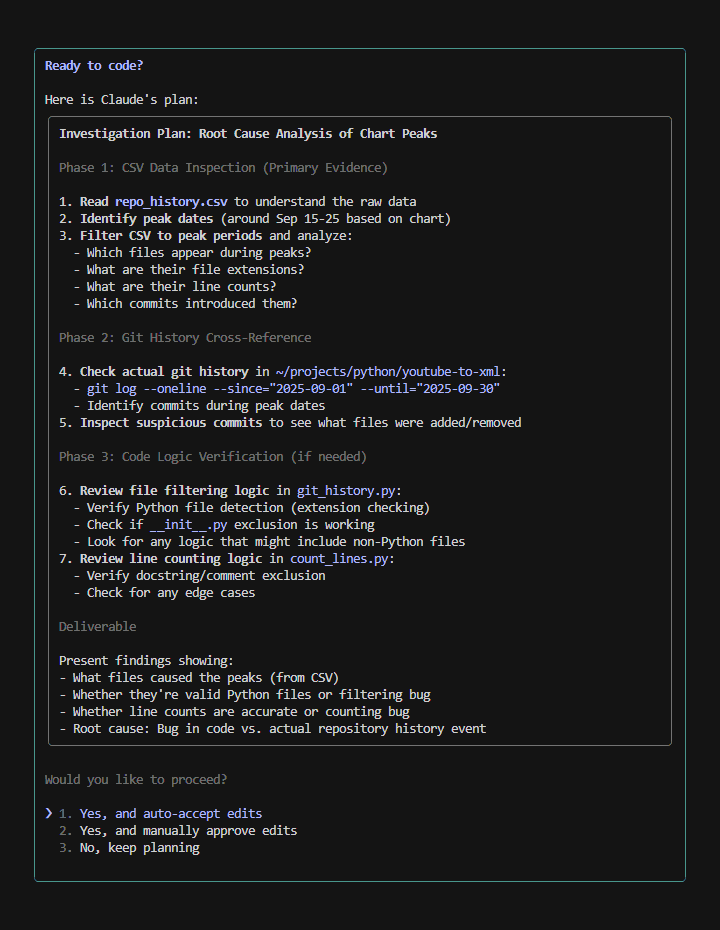
It started executing the plan at speed, a premature celebration followed by a “Wait, this doesn’t make sense”:
Claude Code adjusts and this is what makes it powerful. A minute later the first glimpse of the bug I missed. One which would have taken me far longer to logically realise:
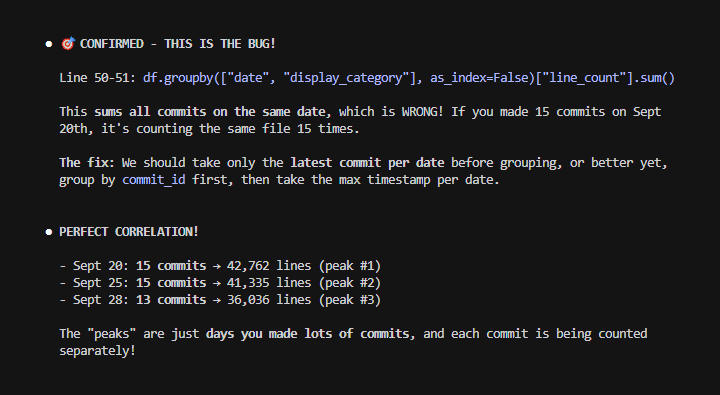
And now the full explanation, supporting data, and proposed fix:
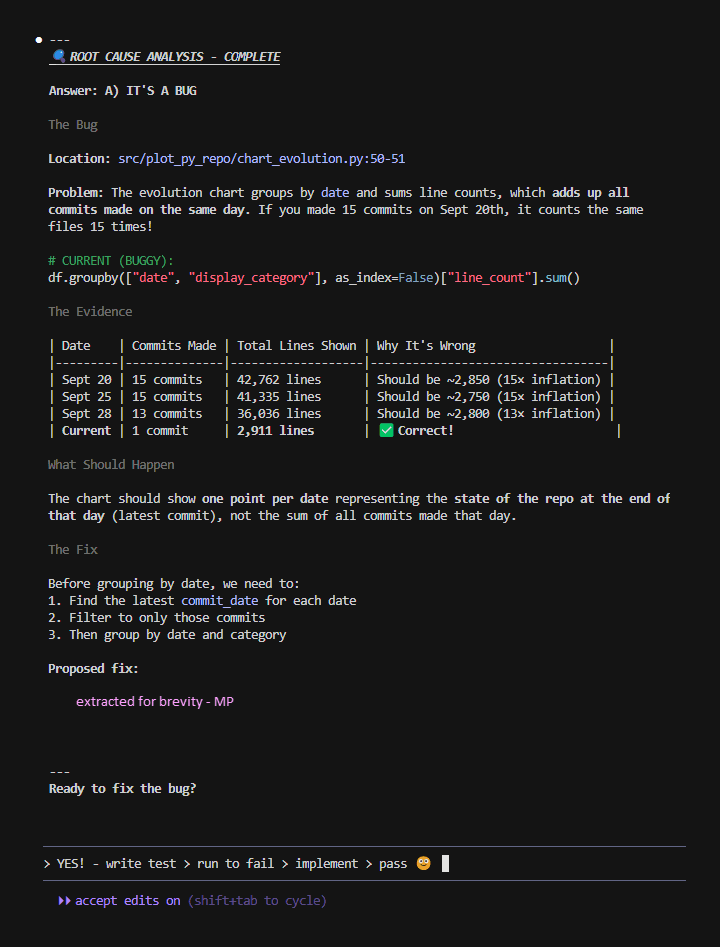
“Ready to fix the bug?” — “accept edits on” — which means Claude Code just goes and nothing needed from me. YES!
Fixed!
And here it is, about 20 seconds later the fixed chart and a completely different story:
A Sneaky Tweak:
Looking at the fixed “right” chart, I obviously didn’t do much August with a big straight flat. Well, I don’t want to tell that story. I’ll do a sneaky tweak and ask Claude Code to make a new chart on the same data:
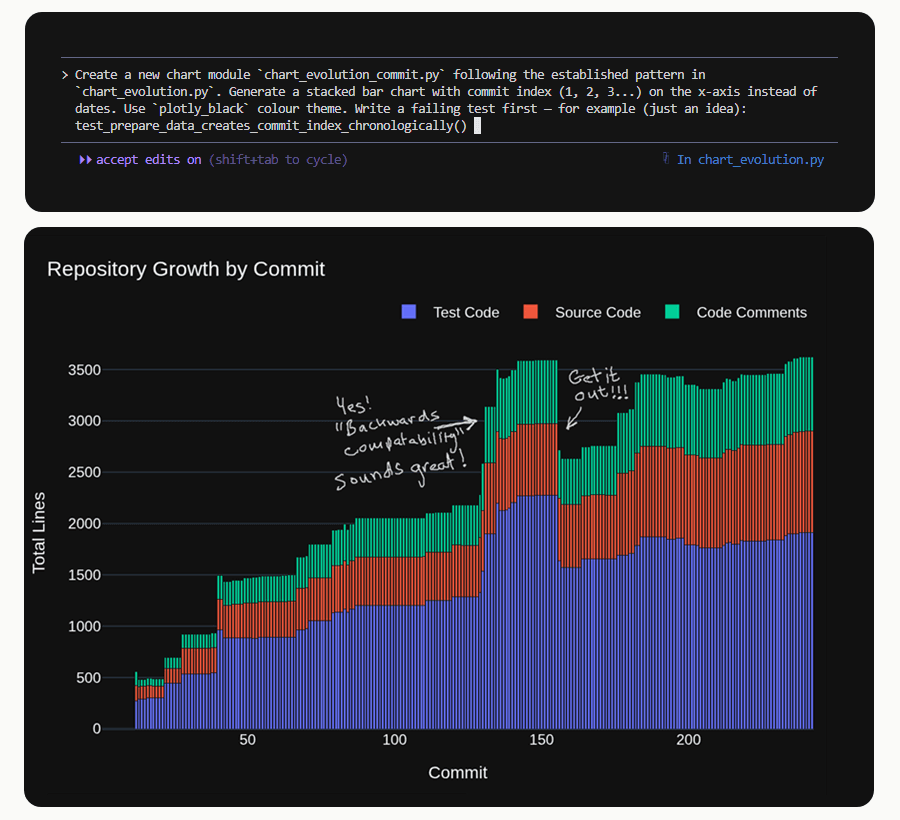
With clean patterns to follow it is surprising how simple your instructions can be. The chart was created in one go. I went on to get Claude Code to do a “peak analysis” between commits [140,160]. And there was too, the cost of good old backwards compatibility.
And that is the story of how Claude Code investigated a data problem, fixed it, and then made me a new chart so I could tell a better story.
The End.
Footnotes
- plot-py-repo — the tool I created with Claude Code to visualise Python repositories ↩︎
- youtube-to-xml — the repository visualised in this article, also created with Claude Code ↩︎